When conducting an energy audit, you always want to identify the projects with the quickest paybacks. Often these are the simplest ideas that require no upfront capital, such as eliminating a waste stream. But how do you find these?
Seize Success by Searching Existing Projects
One tool that can give you a hint regarding opportunities that exist in your facility is the Industrial Assessment Center (IAC) database, which has data from 16,000 different energy assessments collected over decades from universities across the U.S. The IAC database contains over 124,000 recommendations, which are organized by payback period, implementation rate, and other metrics.
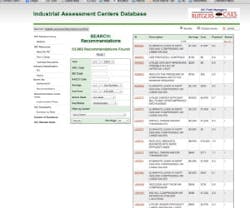
It also records the progress of a highly successful DOE program primarily intended for manufacturing facilities. However, I have found it useful for hospitals, universities, and other clients with similar buildings. Figure 1 gives you a screenshot of the search engine, which can be found here: iac.rutgers.edu/database/. It might require 15 minutes for you to explore the website and learn how to use the tool, but it is worth it.
Using the IAC database, you can do research on many recommendations and get a basic understanding of their feasibility. It should be used as a pre-screening tool before you conduct an on-site audit.
Utilizing the Database Tool
If you look at the data from thousands of facilities over the last 20 years, fixing leaks offers the quickest paybacks (usually less than six months). Fixing compressed air leaks also has an 84% implementation rate, which indicates how many IAC program clients actually implemented recommendations made by the universities. I’ve also found this to be an effective project, so let’s use it as an example.
Assume you are auditing a facility that has steam and compressed air systems. Within the database, you could look at all the saving recommendations relating to those two systems and consider the economic paybacks organized by time period, savings, geographical region, etc. A possible recommendation would be reducing compressed air pressure (Assessment Recommendation Code = 2.4231). As Figure 2 shows, this project usually yields a payback of less than one year and an implementation rate of approximately 50%.
Estimate Savings with Equations
When I perform energy audits, I ask the FM to tell me about their leak repair program. If the facility manager has air compressors or boilers, yet doesn’t have a leak repair program (with inspections about every six months or less), then usually I will find an improvement opportunity. Fixing leaks is analogous to stopping bleeding in an emergency room – it is necessary. FMs should know that leaks also represent bleeding dollars, which can translate to lost salary or jobs. When occupants take the bleeding seriously, on-site staff will direct you to where leaks are occurring. If you need tools, an ultrasonic leak detector with headphones can help. It wouldn’t surprise me if someone develops an app for this process.
Once you find the leak and estimate its size, you can use a variety of charts to approximate the savings. It is okay to be a little conservative (perhaps guarantee only 80% of the savings projection) because the paybacks will still be very short. Below are some commonly used charts. Additional charts and software are available online at www.compressedairchallenge.org.
The compressed air leak chart below expresses savings in kWh, so the average efficiency of the compressor is already factored in.
Example:
If you found a 1/8-inch air leak at 100 psig, then the annual savings (at $0.10/kWh) from plugging the leak would be:
=(23,100 kWh/year)*($.1kWh)
=$2,310 per year
Even if it takes $200 to repair the leak, then the payback would be less than .1 years!
The steam chart below shows the energy lost at the point of the leak, so to determine savings, you must incorporate the efficiency of the combustion to determine the amount of energy required to make up for the losses. Because the efficiency of combustion is always less than 100%, it takes more energy to make up for steam losses. Beyond the savings indicated below, there also would be water, sewer, and chemical treatment savings from leak repairs.
Example:
Assuming you had a boiler that was 80% efficient, if you found a 1/4-inch steam leak at 110 psia, then the annual savings (at $5/MMBtu) from plugging the leak would be:
=[(2,000 MMBtu/year)/(.8)] * [($5/MMBtu)]
=[2,500 MMBtu per year is what Boiler would need to “make up”] * [($5/MMBtu)]
=$12,500 per year
Even if it takes $500 to repair the leak, then the payback would be less than .05 years!
Perhaps these quick survey tools will be helpful for your next energy audit. Remember to always ask about compressed air and steam leaks. Share your success stories with me at [email protected].
------------------------------------------
