U.S. Private-Sector Office Market: Report Shows Relatively Small Changes Over Previous Year
Despite large shake-ups in the commercial real estate world, control-sample buildings from the Building Owners and Managers Association (BOMA) Intl.'s 2007 Experience Exchange Report (EER) that reported income and expenses in both 2005 and 2006 show very little overall change. As the trend toward mixed-use (commercial and retail) buildings continues to grow, the sample shows that retail income in downtown office buildings has increased by 8.6 percent and by a much larger margin in suburban properties (32.9 percent). The other extreme difference in the control-sample buildings is reflected in the reported increase of security costs for suburban properties. From 2005 to 2006, these costs rose by 13.2 percent to 43 cents per rentable square foot (rsf).
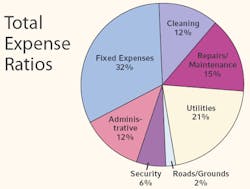
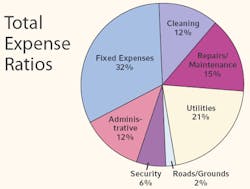
The pie chart (below) demonstrates the overall ratio of individual operating expenses and fixed expenses to total expenses in the overall (downtown and suburban, no control sample) U.S. private sector. For years, fixed expenses - most notably, real estate taxes - have constituted the largest source of expenditures for commercial office real estate (32 percent). Utilities, which are almost entirely energy costs, are again the second-largest component of total expenses (21 percent). The percentages of the remaining expense line items are detailed in the chart. These expense-ratio proportions have remained fairly constant for the past several years. The largest fluctuation is the 4-percent increase for fixed expenses and the 3-percent decrease for repairs/maintenance expenses from 2005.
Class-A Buildings
Class-A office buildings, as defined by BOMA Intl., are the most prestigious buildings competing for premier office users with rents above average for the area. These buildings have high-quality standard finishes, state-of-the-art systems and amenities, exceptional accessibility, and a definite market presence. The income and expense levels of the Class-A buildings reporting are, as expected, higher than the national composite averages. The average total income reported by Class-A buildings is $25.48/rsf; the average total expenses are $10.76/rsf. Both the income and expenses reported by Class-A buildings in 2006 increased over the averages reported in 2005. Class-A buildings made up 58 percent of the reports within the U.S. private-sector sample in the 2007 EER.
Class-B Buildings
Class-B office buildings compete for a wide range of users with rents in the average range for the market. Building finishes are fair to good for the area, and systems are adequate, but the buildings do not compete with Class-A buildings at the same price. In 2006, Class-B buildings reported an average total income of $18.62/rsf, an almost 4-percent increase from the Class-B total income reported in 2005 and almost 37-percent lower than the total income reported by Class-A buildings. Meanwhile, total expenses in Class-B buildings were 9-percent lower than their Class-A equivalents. These buildings made up 38 percent of the buildings reporting.
Class-C Buildings
Class-C office buildings compete for tenants requiring functional space at rents below the average for the market. In 2006, Class-C buildings reported an average total income of $14.77/rsf, which is 73-percent lower than Class-A buildings and 26-percent lower than Class-B buildings. It is important to note that the Class-C building sample was much smaller than the other two data sets, with only 4 percent of those reporting.
City Comparisons
In line with last year's analysis, downtown New York office buildings reflected the highest total income per rentable square foot at $47.66 and the highest total expenses at $20.58/rsf. In the suburban office market, San Mateo, CA, showed the highest reported total income at $39.31; Stamford, CT, properties reported the highest total expenses.
For information on this and other issues, call BOMA Intl. at (202) 408-2662 or visit (www.boma.org).

