Income/Expense Trends in Office Buildings
The U.S. office market ended 2004 on a high note, reporting a 5-percent increase in net operating income (NOI) and a decrease of 6.1 percent in total expenses, according to the data collected and reported in BOMA Intl. 2005 Experience Exchange Report (EER). The U.S. private-sector survey results for calendar year 2004 are the weighted average responses of 3,210 buildings representing approximately 700 million square feet of space.
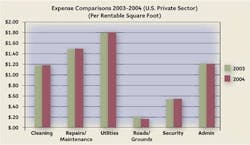
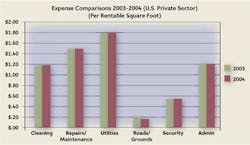
The dollar amount spent on different expense line items provides a mixed picture, but the overall expense data in the 2005 EER indicate that, though total income remained constant at $23.89 per rentable square foot in 2004, the NOI increased by 5 percent ($14.15/rsf vs. $13.51 in 2003). Building management achieved this increase by working to decrease its total operating expenses by 3 percent ($6.32/rsf vs. $6.52), and by decreasing administrative costs, which declined again by 1 percent in comparison with the previous year ($1.22/rsf vs. $1.23 in 2003). Total expenses (operating plus fixed) also declined by 6.1 percent ($9.74/rsf vs. $10.38 in 2003), a significant figure when compared to 2003 numbers. Another notable decrease this year was the dollar amount spent on roads and grounds per rentable square foot of the building ($0.17 vs. $0.21 in 2003). The nominal data also show that some operating expense categories - including cleaning, repairs/maintenance, and utilities - increased slightly from 2003.
With the ongoing war in Iraq and the threat of new terrorist attacks, security remains a major concern for management, reflected by an increase of 2 percent in security expenses ($0.56/rsf vs. $0.55 in 2003). Building insurance costs decreased slightly to $0.37 per rentable square foot of the building in comparison with $0.40 in 2003. However, they remain higher than 2002 when the amount spent on insurance was $0.33 per rentable square foot.
Expenses for utilities showed an increase of 1 percent in 2004 ($1.83/rsf vs. $1.82 in 2003). Cleaning expenses in 2004 also increased marginally by 1 percent, with the industry reporting $1.20 rsf on cleaning costs in 2004 vs. $1.19 in 2003. However, expenditures for roads/grounds showed a significant decline in comparison with 2003 as well as prior years. The industry reported expenditures of $0.17/rsf on roads/grounds vs. $0.21 in the same category in 2003.
Another interesting trend that continued from 2003 is the increase in retail area income in office buildings. With the total income remaining constant in 2004, the retail area income in office buildings increased by 7 percent ($19.85/rsf vs. $18.53 in 2003). It is significant that even though the economic picture is brighter for office buildings, the trend to lease out space to retail outlets to increase income continues.
With a stronger economy and the creation of new jobs in 2004, building occupancy increased slightly in comparison with the year before (88.70 percent in 2004 vs. 88.54 in 2003). In 2004, most markets demonstrated clear signs of resurgence, with the strongest performances from markets in the south and west. However, markets in the east, including Washington, D.C. and New York City, also recorded significant growth. Overall, even though the market continues to favor tenants, there are clear indications of rising rental rates and tightening supplies in the most desirable submarkets and properties.
All signs point to the fact that the economy will continue to strengthen in 2005, and healthy job growth is projected for the foreseeable future in most metropolitan areas. The recovery in the office market is not distant anymore; however, some markets may continue to face some challenges.
The operational statistics and percentages in this article are derived from BOMA Intl.‚ÄövÑv¥s Experience Exchange Report (EER), an annual income and expense benchmarking report for the commercial real estate industry. For a detailed description of the report, visit (www.boma.org).

