Industry Forecast: The Revenge of Goldilocks
Goldilocks is back, and the three bears are on an extended vacation to their posh Florida condo. Because interest rates are not “too hot,” investor demand for office properties has been robust. Sales transactions in first-quarter 2005 totaled $15.8 billion, 26-percent above the transaction volume in first-quarter 2004. Capitalization rates remain low, and prices per square foot remain high. At the same time, economic growth is not “too cold.” Employers have increased their payrolls for 23 consecutive months through April, hiring nearly 3.5 million net new workers. In January, total payroll employment surpassed the prior peak set in February 2001, the height of the dot-com frenzy. The average of 151,000 net new jobs per month created over the past 23 months falls short of the 200,000 level that would signal a healthy expansion, but it has been enough to push vacancies lower and rental rates higher in the majority of office markets.
The office leasing market notched a strong performance in the first quarter. Vacancies fell, absorption outpaced completions by a wide margin, the construction pipeline remained subdued, and average rental rates rose modestly for Class-A and Class-B space in central business districts (CBDs) and suburbs. The average vacancy rate fell by 40 basis points to end the first quarter at 16.4 percent, matching its pace of decline over the prior 3 quarters. If vacancy continues to fall at this pace, it will reach the rule-of-thumb equilibrium level of 10 to 12 percent by year-end 2007, a reasonable expectation if the economy avoids any big pitfalls. This is the level at which rental rate increases match the rate of inflation - approximately 3 percent per year.
The average suburban vacancy rate of 17.1 percent is higher than the 15-percent average CBD vacancy, but the recovery is more brisk in the suburbs where vacancy has fallen 230 basis points from its peak compared to just 40 basis points in CBD markets. One reason for this is that suburban rental rates are lower than CBD rates in the majority of markets, attracting cost-conscious tenants to the suburbs. Another possibility is that the large, publicly traded corporations and financial institutions filling downtown high-rises are more prone to mergers and layoffs compared to the smaller, privately held companies that locate in the suburbs.
The Inland Empire east of Los Angeles (the Riverside-San Bernardino-Ontario metropolitan area) and Dallas-Fort Worth areas have the lowest and highest major-market vacancy rates in the United States (at 8.4 percent and 24.2 percent, respectively). Over the past 4 quarters, vacancy decreased in 40 of 49 markets tracked by Northbrook, IL-based Grubb & Ellis Co. Vacancy plummeted by 530 basis points in San Jose-Silicon Valley, more than any other market, which is amazing since San Jose is only one of two metropolitan areas where payroll employment shrank during this period (the other one being Detroit). Because the ranks of the self-employed are not counted in the U.S. Department of Labor’s payroll employment survey, it could be that San Jose technology companies are hiring independent consultants instead of full-time employees to maintain a flexible workforce and hold down healthcare costs. Similar market dynamics seem to be occurring in nearby San Francisco and San Mateo, CA, where vacancy rates are falling in the face of payroll employment growth that remains tepid. Even more surprising is that rents in these latter two markets have been increasing in recent quarters, even though vacancy rates are still elevated.
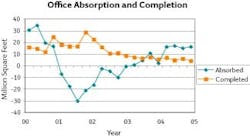
Over the past 4 quarters, the market has absorbed space at 3-times the rate of new completions, meaning that demand has been outpacing new supply by a wide margin, driving down the vacancy rate. Absorption has been remarkably consistent during this period; in the range of 15 to 17 million square feet per quarter. Northern and Central New Jersey and metropolitan Washington, D.C. finished the first quarter in a virtual tie, both absorbing 2.1 million square feet. Third-place Los Angeles and fourth-place San Jose, CA, also finished in a dead heat, with nearly 1.1 million square feet absorbed in each market. A few areas continue to see demand slip, led by Cincinnati; Columbus, OH; and Detroit, but even fast-growing Phoenix got off to a slow start with negative absorption in the first quarter.
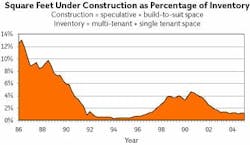
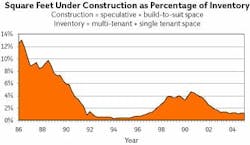
The amount of space in the construction pipeline totaled 40 million square feet at the end of the first quarter, relatively unchanged for the past 2 years. Of this total, 33.7 million square feet is speculative and 6.3 million square feet is build-to-suit. Five spec buildings in excess of 500,000 square feet are under construction in CBD markets, including three in Chicago and one each in Philadelphia and Manhattan. Four non-CBD projects also fit this profile: two in southwest Washington, D.C. and one each in Los Angeles (Century City) and Atlanta (Midtown). The downtown markets in Chicago and Philadelphia will be challenged as their new high-rises are completed. Pre-leasing is healthy - 90 percent in Philadelphia’s Cira Centre and 67 percent combined in Chicago’s 111 S. Wacker, 1 S. Dearborn, and 550 W. Adams - but the tenants will vacate space in existing buildings, putting downward pressure on CBD-wide rental rates as landlords struggle to fill the holes.
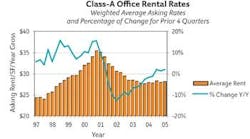
While the office market recovery has been under way for several quarters, asking rental rates have stabilized only recently. Class-A and -B asking rents increased 1.8 percent and 2.2 percent, respectively, over the prior 4 quarters. Class-A asking rents posted year-over-year gains in 33 of the 49 markets that Grubb & Ellis tracks, led by a spike of 11 percent in Orange County, CA. A few markets and submarkets continue to see rental rates decline, however. The average Class-A asking rate fell by 4.8 percent in Grand Rapids, MI, and by 4.1 percent in San Jose, CA, over the past 4 quarters, though the latter market is beginning to see rent increases in selected submarkets and properties. Tenants will cough up an average of $55.70 per square foot to lease Class-A space in New York City, the nation’s most expensive market. The average is even higher in Midtown at $61.55. To reduce their rent costs, tenants should consider Wichita, KS, where landlords offer the lowest average Class-A rent in the United States (at $16.23). These rental rates are quoted per square foot per year and on a full-service gross basis, meaning landlords pay expenses.
Sublease space offered on the market continues to fall at a steady pace, ending the first quarter at 96 million square feet. This is down from the peak of 146.5 million square feet 3 years ago, but still about 3-times the late-1990s average when dot-com mania drove frenzied demand. New York City claims 12.4 million square feet of available sublease space, the highest total among all markets. But nearby Fairfield Count, NY, has the highest ratio of sublease space to total office inventory at 6 percent, well ahead of the 2.7-percent national average, followed closely by San Mateo, CA, and Boston.
In the Future
Will the Goldilocks market end with a bang or a whimper, and when will that be? The office leasing market is in a sustained recovery cycle following the recession of 2001 and the jobless recovery of 2002 and 2003. Landlords are not out of the woods yet, and tenants continue to wield bargaining power in the majority of markets. But the pendulum is swinging back toward the middle - quarter by quarter, building by building. Expect more of the same over the next few quarters - slowly tightening vacancies that will translate into slowly rising rental rates. The pace of the recovery will be uneven, varying by region of the country (slower in the Midwest), market, submarket, and building class. High-quality spaces in the most desirable submarkets will disappear first, and as rents rise for the better spaces, tenants will begin to trade quality for rent.
On the investment side of the ledger, analysts have been wondering out loud if there is a bubble in light of the high prices being paid for office buildings and the multi-year recovery cycle still ahead of the leasing market. The Federal Reserve is expected to continue raising the short-term federal funds rate in 25 basis-point increments at each of its next few meetings until it reaches a neutral level, although there is no clear-cut definition of “neutral.” Long-term rates, which have surprised analysts by remaining low in the face of Fed tightening, are likely to follow suit, but the timetable for this is clouded. Given the volume of capital chasing real estate, it seems unlikely that a 10-year Treasury rate in the range of 5 to 5.5 percent, which most economists expect by year-end 2006, will be enough to derail investor demand. It may create problems for the owners of Class-B office assets financed with floating rate debt, since these properties will be last in line to benefit from the improving leasing market. It may actually benefit institutional investors who use relatively little debt, because they may gain access to a wider selection of properties as interest rate-sensitive players lose their competitive advantage. So it seems as if investor demand for office properties will cool slowly over the next few quarters as long-term interest rates rise slowly.
If foreign governments decide to sell their U.S. Treasury holdings en masse, it could trigger a spike in inflation and interest rates. The bond market looked shaky in May when South Korea signaled that it might want to diversify its holdings away from the dollar. While currency destabilization is a possibility, it is hard to predict when, if ever, this might occur. The United States could forestall such an outcome by reducing its budget deficit while encouraging China to gradually (perhaps over a period of years) abandon its currency peg to the dollar. Rather than a spike, the more likely scenario seems to be a moderate increase in interest rates over the next 18 months, leading to a gradual “return to normalcy” in the investment market - not a sudden and destructive bursting of a bubble.
Bob Bach is national director, market analysis, at Northbrook, IL-based Grubb & Ellis Co. (www.grubb-ellis.com).


